Real-time insights for optimized mineral processing
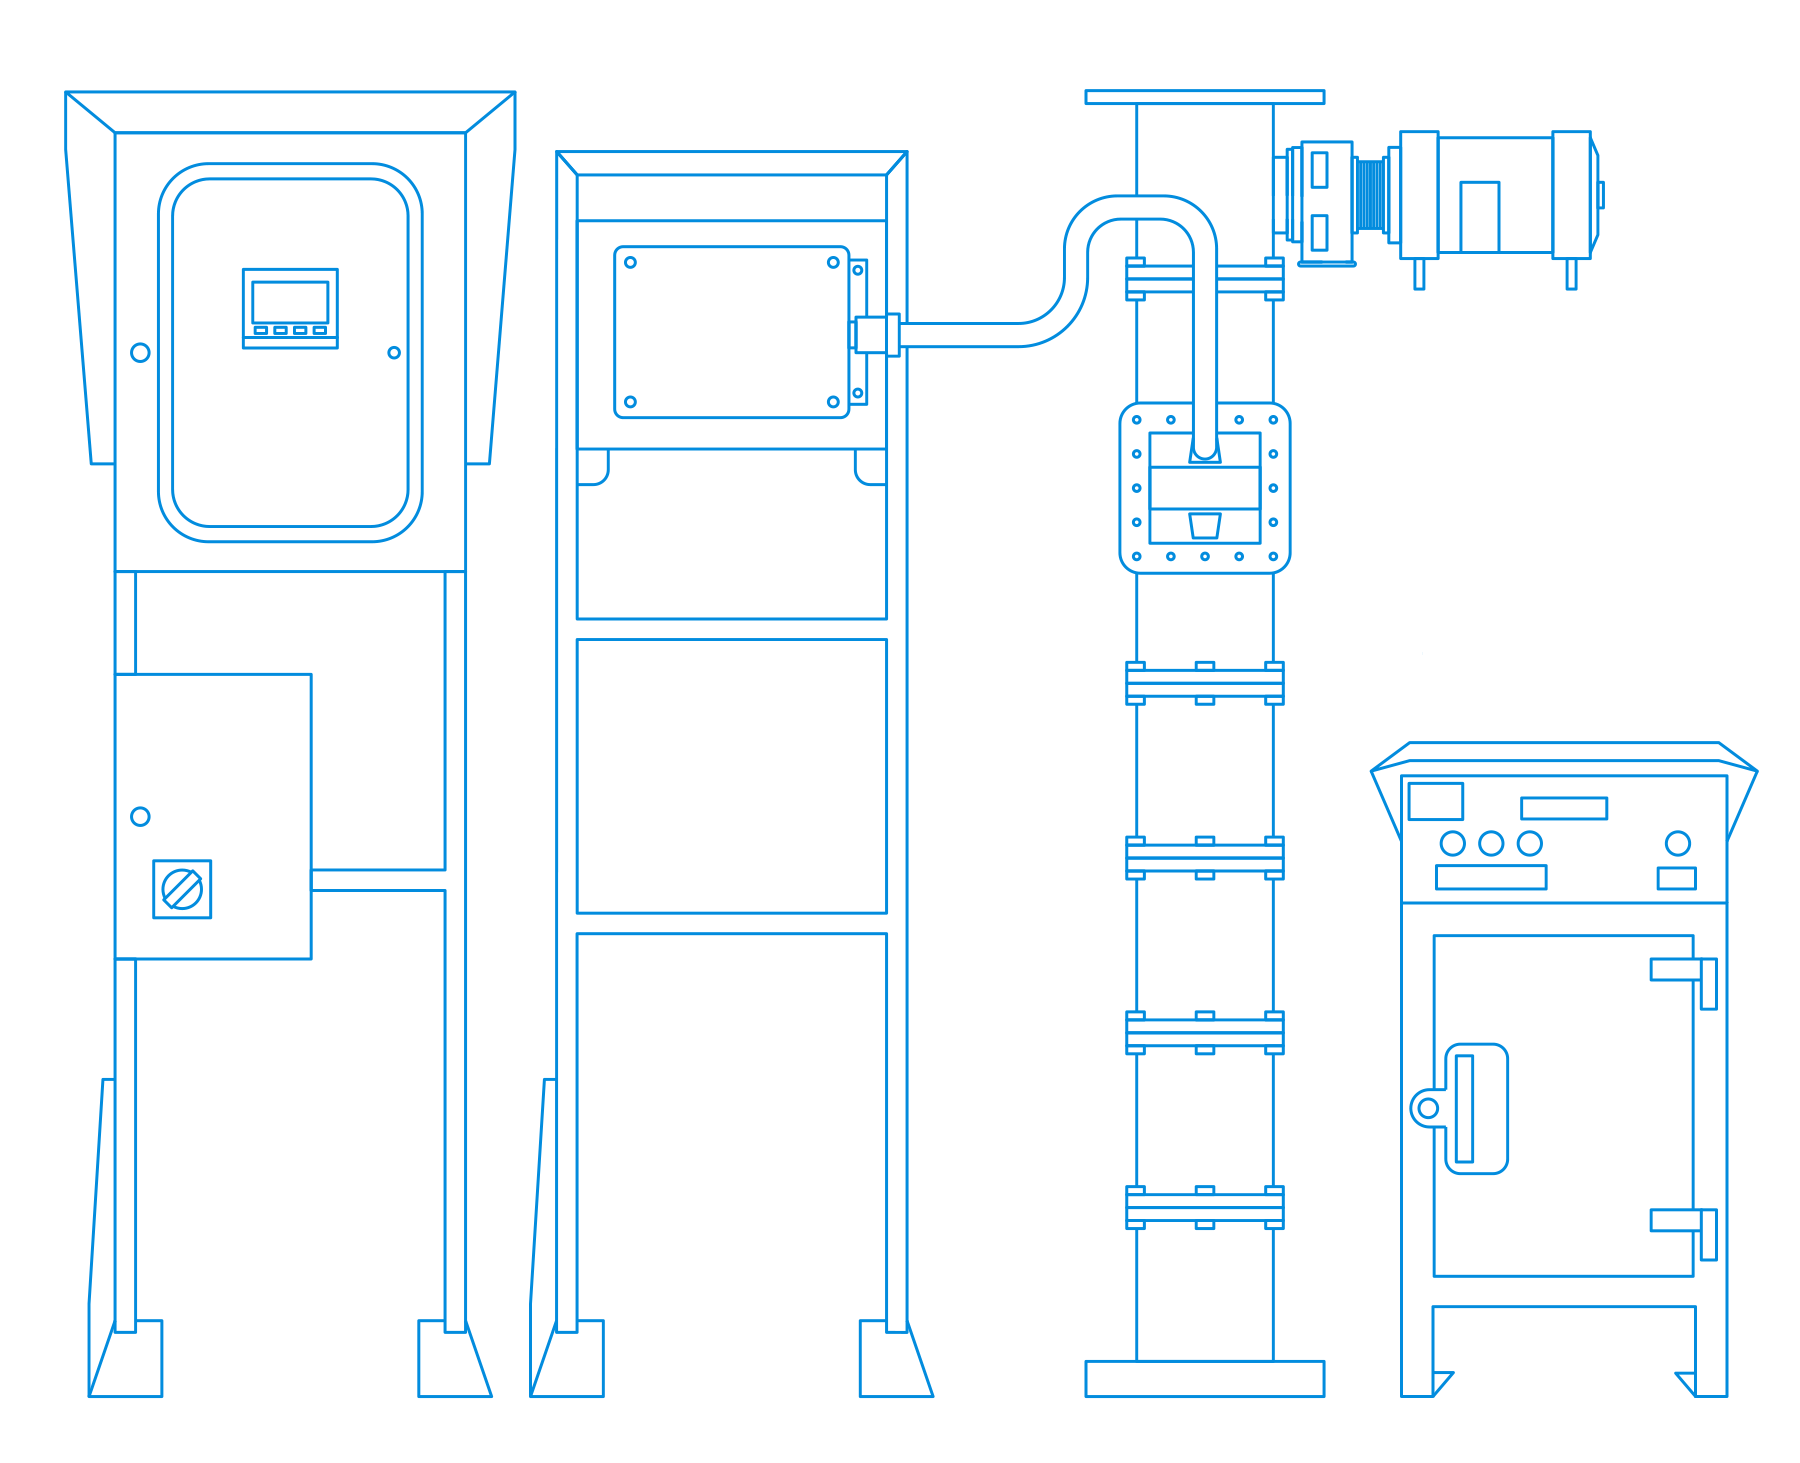
Introducing the Blue Cube Slurry Analyzer, the in-line instrument that measures the composition of slurry streams in real-time. This analyzer continuously scans the contents of the process stream directly, without removing it from the pipe, resulting in a measurement that is truly representative of the real process.
This innovative solution provides in-line mineral quantification in real-time, enabling data-backed process control to optimize your operations.

In-line measurement

Unmatched range

Low maintenance

Fast response
“Implementing the Blue Cube Slurry Analyzer has revolutionized our process. The real-time insights provide us with more control, enabling us to minimize impurity penalties.”
Chrome Mine, Africa

Process
Measure
Measures various parameters such as mineral grade, elemental grade, particle size fraction, and % solids. Measures in-line, continuously, updating every 15 seconds. Installed on pumped, upward-flowing process lines of any diameter greater than 25mm.
Control
Rapid measurement updates enable effective process stabilization through automatic process control. Automatic manipulation of air addition, pulp levels and reagents are suggested for the control of grade and recovery in typical flotation circuits.
Optimize
With the availability of real-time data, the effect of process changes can be tracked without having to do full plant surveys. The Blue Cube Slurry Analyzer can be used together with a mass flow indication to optimize recovery. Product grade can be optimized, and the impurity content minimized to eliminate penalties.
Upfront Amenability Studies
We offer clients the opportunity to evaluate our technology directly on their own flotation slurries, easily and cost-effectively, prior to any commercial commitment through amenability tests. These tests are carried out using the Blue Cube Portable Test Unit (PTU), which packs away conveniently into a small industrial briefcase, so it can be transported to a test site easily, and set-up in a wet lab on site.
To perform a full amenability demonstration, at least 45 individual samples of approximately 250ml of slurry covering a representative range of operation are withdrawn from the slurry stream of interest. Each sample is then introduced, circulated, and scanned by the PTU instrument – emulating the in-line analysis of the industrial instrument. After scanning, the samples are discharged into sample containers and sent to the client’s laboratory for analysis.
Once the analysis is complete, a subset of the lab results is used together with the recorded spectra to build a calibration model. This calibration is then used to provide estimates for all the samples, including the withheld/blind samples.
Request a meeting


